Getting started
The interface
A tour of the studio: palette, flow, browser, config and console.
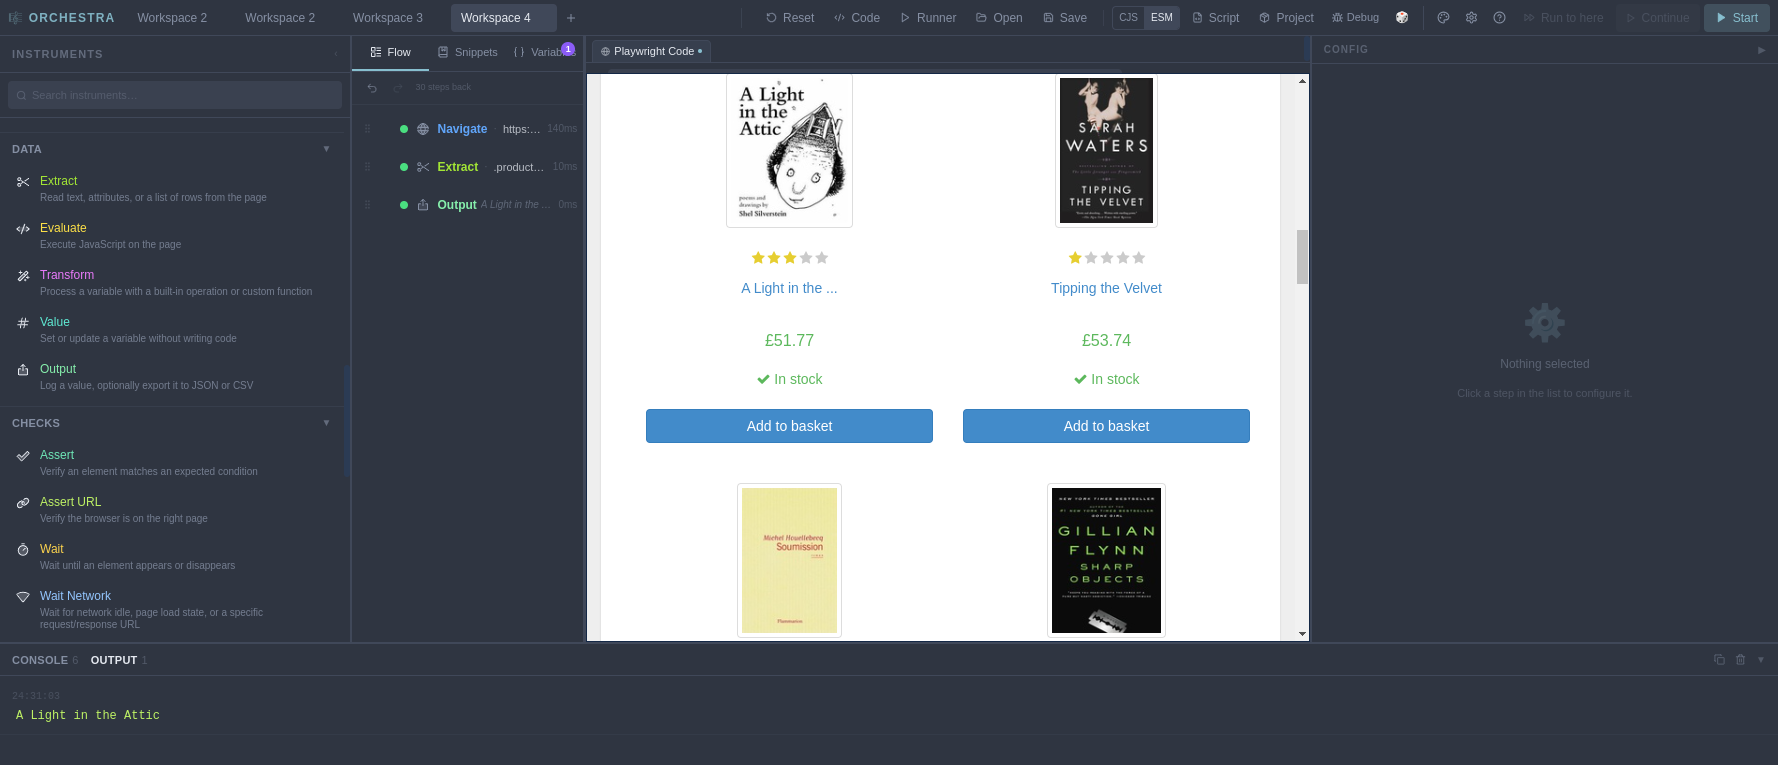
Orchestra's window is a studio with five regions around an embedded browser. Every divider between panels can be dragged to resize, the outer panels collapse out of the way, and the layout you settle on is remembered.
Top bar#
The top bar holds your workspace tabs on the left — each tab is a separate automation project (see Workspaces) — and the toolbar on the right:
| Control | What it does |
|---|---|
| Reset | Clears the browser's cache, cookies and storage and returns to a blank page |
| Code | Opens the live Playwright code window (Code view & export) |
| Runner | Opens a clean run-only window with just variables and the console |
| Open / Save | Load and save the workspace as a .json file |
| CJS / ESM · Script · Project | Export the flow as a standalone script or a runnable project |
| Debug · 🎲 | Run pacing: fixed 800 ms per step, or a random human-like delay |
| 🎨 · 💬 · ⚙ · ? | Themes, feedback, settings, and the built-in help |
| Run to here · Continue · Start | The run controls — replaced by Resume / Stop while running |
Instrument palette (left)#
Every instrument, grouped into eight categories. Click one to append it to the flow, or search by name. The palette can collapse to give the flow more room. Every instrument is documented in the instrument reference.
Flow panel#
The flow panel shows your automation as an ordered list of steps and has three tabs:
- Flow — the steps themselves. Drag any step to reorder, click between two steps to insert one right there, and expand containers (Group, Condition, Each…) to see their children. While running, each step shows its live status and timing.
- Snippets — reusable blocks of steps you can drop into any flow (Cues & snippets).
- Variables — the workspace's input variables, as a table or raw JSON (Variables). A badge appears here when a run creates new variables.
Embedded browser (center)#
A real Chromium browser, driven by the same engine your exported scripts use. Its toolbar has, from left to right:
- A connection dot — green when the automation browser is attached; if it turns red, click Reconnect.
- Back / Forward buttons and an address bar.
- Viewport presets — Desktop, Laptop, Tablet, Mobile — to test responsive pages at fixed sizes.
- Orchestrate — records your actions on the page as steps (Recording).
</>— opens Chromium DevTools for the page.- Pop out — moves the browser into its own window (handy on small screens); click again to focus it.
Above the toolbar, a tab strip tracks every tab the page opens — automations can switch between and close them.
Config panel (right)#
Selecting a step opens its configuration: the instrument's fields, a live preview for data-touching steps (Extract, Transform, Output, Assert show what they would do against the current page), modifiers, error handling, and two per-step run buttons — Play this instrument and Step (run it, then advance to the next).
Console (bottom)#
Two tabs: Console, a timestamped log of every step's status, duration and errors, and Output, which collects only what your Output steps emit. Details in Output & data. Click the header to collapse it.